
Part:BBa_K3944032
ScGAL1+Z3BS - GFP
Galactose promoter proceeded by Z3BS recognition sequences to induce downstream expression of GFP gene upon addition of estradiol, used to benchmark cellular system transcriptional response to estradiol. Requires estradiol-sensing protein present in the cell to function, see here. For an overview of the whole project, please visit our wiki.
Sequence and Features
- 10COMPATIBLE WITH RFC[10]
- 12COMPATIBLE WITH RFC[12]
- 21COMPATIBLE WITH RFC[21]
- 23COMPATIBLE WITH RFC[23]
- 25INCOMPATIBLE WITH RFC[25]Illegal AgeI site found at 169
- 1000INCOMPATIBLE WITH RFC[1000]Illegal BsaI.rc site found at 1223
Aims
We set out to construct a yeast strain that could be altered/programmed on the fly to produce different types of fatty acid. Our proposed method involves three different induction systems linked to different thioesterases, which are proteins that terminate fatty acid synthesis at specific lengths by cleaving off the ACP moiety from the growing chain, determining its length dependent on the preference of the enzyme. In order to verify the function of our system, we constructed induction systems expressing fluorescent proteins, making for easy verification via fluorescence measurements. In addition to this estradiol-dependent induction plasmid expressing GFP with green fluorescence, we also constructed and tested induction systems Copper with RFP and TetON with BFP.
Usage and Biology
Green fluorescent protein (GFP) is a well-known and well characterized fluorescent protein from the jellyfish Aequorea victoria (1). It is commonly used to measure expression levels as the fluorescent output is proportional to the level of protein expressed. The estradiol transcriptional system originates from human estradiol hormone signalling pathways, with the estradiol ligand binding domain forming a key signal transduction protein in human hormone signalling (2). Similarly, the zif268 zinc finger domain, which binds to the short recognition sequence Z3BS upon being activated, also originates from the human body, being a key component in regulatory and transcriptional events of human neuronal cells (3). By moving this system to other organisms, a reliable way expressing desired genes can be obtained, since both estradiol and zif268 are tightly regulated in the human body. By placing Z3BS repeats before the GAl1 promoter from S.Cerevisiae, a strong induction can be attained that is tightly regulated by the addition of estradiol. As the system requires the introduction of the estradiol-sensing protein, building a single plasmid with both the promoter/gene system and constitutively expressed sensing protein, a single-transform induction system can be created, making use much easier.
Experimental design
The seven Z3BS repeats were obtained on a plasmid with the ScGAL1 as a single unit, optimized for use in S.Cerevisiae. By designing primer pairs that leaves the Z3BS/ScGAL1 and GFP sequences with overlaps to one another, the Estradiol-sensing protein and the p416TEF plasmid backbone, the plasmid can be assembled in a one-pot Gibson assembly reaction, which has been shown to work with up to 12 insert fragments, designed as such that the promoter/gene region is inserted in the reverse direction to avoid potential transcribing/overlap errors with the estradiol-sensing protein. The created plasmid is then ready to use in benchmarking experiments, where we prepared cells of S.Cerevisiae strain CEN.PK 102-5B with all possible plasmid combinations: Single cells with CUP1, TetON and Estra, Double cell lines with CUP1-TetON, CUP1-Estra and TetON-Estra and a final tripple strain with CUP1-TetON-Estra. Measuring the fluorescence of these cell strains not only allow us to compensate for overlaps in fluorescence spectra to obtain accurate signals, but also allow for the measurement of the interactions between induction systems and how the presence of several systems in a yeast cell affect its viability.
Methodology
Templates of Z3BS7/ScGAL1 and GFP-containing backbone p416TEF provided by our department were mixed with the corresponding forward/reverse primer pair and PCR reaction performed with Phusion polymerase according to protocol to create the inserts. The created insert fragments and cloned backbone fragment were purified using gel purification and ThermoFischer gel purification kit, followed by assembly using the Gibson assembly method according to protocol. The assembled plasmid was transformed into competent E.coli of strain DH5-alpha, grown overnight, inoculated to be grown overnight again and then harvested with miniprep. The harvested plasmids were sequenced and then transformed into the yeast cells to create the seven different strains described: CUP1, TetOn, Estra, CUP1-TetON, CUP1-Estra, TetON-Estra and CUP1-TetON-Estra. CUP1 and Estra-containing strains were measured using GUAVA flow cytometer machine, but due to inadequate ability to detect blue fluorescence, all cells containing TetON with BFP had to be measured using a Sony FACS machine. The FACS machine is a manual machine where each sample is analysed separately, limiting the amount of induction cell/inducer combinations and experiments that could be performed for all strains with tetracycline/BFP plasmid. Thus, data availability is greater for samples with either copper, estradiol or both. During the experiments, the instrument was setup as to compensate for overlaps in excitation/emission spectra between the fluoropores, particularly the problematic BFP/GFP emission/excitation overlap, eliminating signal distortions from this source. The results were collected as excel files and processed to determine expression efficiency.
Results
Single plasmid experiments were conducted, where fluorescence from each individual plasmid was tested with different inducer concentrations.
Single Estradiol plasmid
GFP gene expression was coupled to the estradiol induction system, where the intensities from different inducer concentrations with a single plasmid is provided in figure 1. In this case it is rather clear that for both experiments, the two highest expressions are achieved for concentrations 0.01 and 0.001 µM of estradiol. For experiment B the correlation between increased intensity and increased concentration is also clearly visible. When comparing the control group with the non-induced sample, there is a slight level of expression observed for the non-induced control, for both experiment A and B, indicating that the estadiol system is also leaky, though the difference is still far from any of the induced ones, meaning that the inducer affects the system expression significantly.
Something that is for clear for experiment A in figure 1, is that all induced sample groups are expressing some intensity on the same level as all of the control groups, meaning that they do not express the fluorescent plasmid at all, indicating that the plasmid has dropped out of the cell, which is especially clear for experiment A where there was lag time from adding the cells to the microwells and the actual measurements, described in greater detail in the notebook. However, there are still some similar results for experiment B, indicating that the plasmid itself drops out of the cell more easily.

Figure 1: Violin plot of GFP expression from single induction plasmid in yeast strain (CENPK 10-5B, from two experiments, A and B. Measured with Guava. Pairwise statistical tests between controls (0uM added inducer) and remaining samples in each strain were performed using unpaired two-sided Wilcoxon-rank-sum tests (ns: not significant, *p < 0.05, **p<0.01,***p<0.001,****p<0.0001)
The results provided by the density plots in figure 2 shows the same thing as in figure 1 but in a different way. The peaks for concentrations 0.01 and 0.001 µM in the bottom two graphs display a clearer difference in expression than the other samples, illustrated by a light colour gradient, confirming together with figure 1 that the estradiol system has a high dynamic range with less leakage.

Figure 2: Overlapping density plots of GFP expression for all concentrations of estradiol inducer. Measured with Guava.
Combinatorial benchmarking (two induction systems)
Although the single plasmid results indicate that the induction systems are functional, it does not explore the potential effect they could have on each other. For this reason, we also tested dual plasmid combinations in the same fluorescence manner as the single plasmid systems. The GFP and RFP combination was tested using the Guava flow cytometer while the others with BFP were tested using the FACS machine.
Dual plasmids of Copper and Estradiol induction
The results from the yeast strain with the copper and estradiol dual plasmid system are displayed in figure 3. The left violin plot shows the GFP expression for different estradiol inducer concentrations (Est) and the right plot shows the RFP expression for different copper inducer concentrations (Cup). The violin plot for GFP shows clearly that the expression increases when estradiol is added, with or without the copper inducer. There also does not seem to be a change in expression between the samples with 0/0.01 µM (0 µM copper inducer and 0.01 µM estradiol inducer) and 100/0.01 µM, indicating that the system is not affected by the copper. The right plot for the RFP expression is, however, not as clear as the estradiol one. The RFP expression does not seem to change much for either of the inducers, but there is a slight increase when comparing the 100/0.01 sample with the 0/0 sample, but it is not as distinct as in the estradiol case.

Figure 3: Violin plots of GFP (GRN.B.HLog) and RFP (RED.R.HLog) from yeast strain containing copper and estradiol plasmids. Measured with Guava. Pairwise statistical tests between controls (0uM added inducer) and remaining samples in each strain were performed using unpaired two-sided Wilcoxon-rank-sum tests (ns: not significant, *p < 0.05, **p<0.01,***p<0.001,****p<0.0001)
For additional clarifications there are also density plots for green and red fluorescent expression provided in figure 4. Both of the plots on the left show the GFP expression, and it is rather clear in both graphs that the expression increased as the estradiol inducer is added. The bottom one also shows that the expression does not change as the copper inducer is added, just as the violin plots also did. The RFP on the right side of figure 4, is on the other side of the spectra, and is not as clear. However, the bottom graph displays more clearly that the RFP expression is higher for the sample with both copper and estradiol, which indicates that the copper system increases in expression when estradiol is added.

Figure 4: Overlapping density plots for GFP and RFP expressions from yeast strain containing both copper and estradiol plasmids. Measured with Guava.
A comparison of the given fluorescent expression for GFP compared to controls is given in figure 5. The graph shows a large difference in expression between native yeast and transformed one, corroborating the notion that the system leaks. The most interesting aspect is, however, that there is no difference in expression between case and control with 0.01 µM estradiol and/or 100 µM of copper, meaning that the estradiol system is not affected by the copper inducer.

Figure 5: Violin plots of GFP expression from three yeast strains, one case and two controls. Measured with Guava. Pairwise statistical tests between controls (0uM added inducer) and remaining samples in each strain were performed using unpaired two-sided Wilcoxon-rank-sum tests (ns: not significant, *p < 0.05, **p<0.01,***p<0.001,****p<0.0001)
A similar violin plot for RFP with controls, is displayed in figure 6. The result from this figure shows a great difference in expression if a plasmid is integrated (case) or not (CENPK control) into the yeast, showing the leakage of the system. The most important aspect in this figure is the difference in expression between the 100/0.01µM samples. For the control with only the copper plasmid integrated, the expression is much lower than for the yeast with both estradiol and copper plasmids, providing additional results that support the notion that the copper system is affected by the presence of the estradiol plasmid

Figure 6: Violin plot of RFP expression from three yeast strains, one case and two controls. Measured with Guava. Pairwise statistical tests between controls (0uM added inducer) and remaining samples in each strain were performed using unpaired two-sided Wilcoxon-rank-sum tests (ns: not significant, *p < 0.05, **p<0.01,***p<0.001,****p<0.0001)
Dual plasmids Tetracycline and estradiol
The results from the yeast strain containing both tetracycline and estradiol plasmids are given in figure 7. The left violin plot shows the logarithmic value of BFP (log_BFP) while the left shows the GFP expression (log_EGFP). The provided BFP results shows, as discussed for the single plasmid results, that the tetracycline system is leaky due to the similar expression both with and without inducer. The GFP expression from estradiol is rather similar for non-induced sample and induced sample, though there is a higher expression intensity from the induced sample.

Figure 7: Violin plot of BFP and GFP from yeast strain with tetracycline and estradiol plasmids. Measured with FACS.
The density plots of the same samples are provided in figure 8, where the expression for both BFP and GFP is clearer than in figure 7. The bottom plot on the left for BFP shows a higher expression when the system is induced then when it is not. Thus, the inducers will change the expression slightly when added. For the estradiol system the highest GFP expressions are only shown for the induced sample, indicating a change when inducers are added. There is still a large portion of the expression overlapping between the samples, showing leakage.

Figure 8: Overlapping density plots for BFP and GFP expressions from yeast strain containing both copper and estradiol plasmids. Measured with FACS.
Conclusions dual plasmid experiments
The results from the dual plasmids displays a somewhat clear increase in fluorescent expression in an induced sample compared to a non-induced one. Indicating that the system is functional to some degree. However, there is still a noticeable expression from the non-induced sample for more or less all strains. Thus, showing that all three systems leak to some degree. Additionally, the estradiol was not affected by the copper plasmid, as it provided the same signal with or without copper inducer. The opposite could be said for copper, where the overall output signal was higher for strains with the estradiol plasmid even when there was no inducer present.
Overall, it could be observed that the system works for dual plasmids more or less successfully, thus, providing data that the plasmids and systems work together.
Combinatorial benchmarking (three induction systems)
Fluorescent expression analysed for the strain containing all three induction plasmids are given as violin plots in figure 9. The plots show the three fluorescent expressions separately for three different inducer concentrations. The TetON-BFP (log_BFP) plots shows an increase in expression when the tetracycline inducer is added compared to when it is not added, though the difference between the two concentrations of inducers does not seem to affect the system greatly, but the increase in expression with the added inducer shows that the system is still functional to some degree with all three plasmids. The plot in the centre for Estra-GFP (log_EGFP) expression does not change between the non-induced sample and the induced ones, indicating that either the system is inhibited by the other plasmids or that the plasmid has dropped out of the cell. For the right and last plot, the expression of Copper-RFP (log_miRFP670) is displayed. The expression increases as the copper inducer is added, indicating that the system is still functional. As previously shown, the RFP induction did increase as the estradiol inducer was added, but this is not the case in this experiment, which means that the copper system might only be affected by the other plasmids rather than other inducers.

Figure 9: Violin plot of BFP, GFP and RFP from yeast strain with tetracycline, estradiol and copper plasmids. Measured with FACS. Pairwise statistical tests between controls (0uM added inducer) and remaining samples in each strain were performed using unpaired two-sided Wilcoxon-rank-sum tests (ns: not significant, *p < 0.05, **p<0.01,***p<0.001,****p<0.0001)
Density plots of the same data as in figure 9 is shown in figure 10, where the close expression overlap shown in the violin plots from figure 9 becomes extra clear. The slight increase in expression for both BFP and RFP is especially clear in the bottom graphs, where the induced samples are located more to the right or higher up on the expression axis. The GFP density plot in the middle is almost identical for all samples.
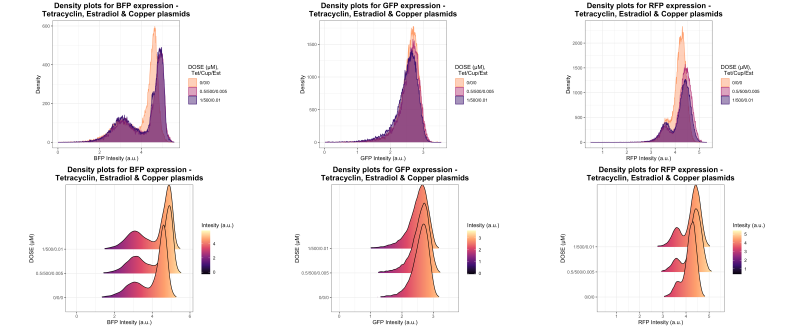
Figure 10: Overlapping density plots for BFP,GFP and RFP expressions from yeast strain containing both Tetracycline, estradiol and copper plasmids. Measured with FACS.
Conclusions combinatorial benchmarking
The overall results from the triple plasmid system shows a slight increase for TetON-BFP and Copper-RFP when inducers are added, but not for the Estra-GFP, meaning that the system works for BFP and RFP, but not for GFP. The results from the dual and single plasmid systems shows that the estradiol system functions the best out of the three systems, and it should translate to the triple plasmid system. The single plasmid systems also showed that the estradiol plasmids most likely has a faster plasmid drop-out rate, which could be the reason for the estradiol system results.
Discussion
The combinations of all experimental data for the plasmid induction systems shows that all three systems should work rather well, with some leakage, and also shows that the plasmids are affected when more plasmids are present in the same cell. Interestingly enough the results provided by the guava machine showed a much clearer expression separation for different inducers than the FACS, which is something that could be taken into consideration when additional testing is performed in the future. Another beneficial part of using the guava is the automatic sampling from a microplate, which helps increase the amount of different inducer concentrations when needed. Therefore, for a future perspective, when benchmarking a precise amount of inducer for a specific output signal a wellplate reader such as the guava will be the better choice and the BFP gene should be replaced to ensure compatibility.
Another important aspect that needs to be tested in the future, is in which growth phase each inducer is the most efficient and has the best function. Because as of now each inducer were tested using the same procedure, expect for experiment A for single plasmids of copper and estradiol which suffered from some time lag, further described in the notebook, though essentially, the cells were cultivated for a longer period of time before being measured in the guava, which might be a reason for the higher numeric value of expression of experiment A compared to experiment B in figure 1 and 3.
To summarize the results, all systems were proven to work to some degree, and to be dependent on concentration of added induction agent, which are the key results for the future of our project.
| None |